Explore our blog featuring articles about farming and irrigation tips and tricks!
How Quiet Is It?

Back when there were only three television channels and Johnny Carson was the king of late night, one of his running gags was a reference to Burbank’s summer weather where the audience would shout back: How hot is it?
A lot of us would like to know what the answer to that question will be this summer, having just experienced the warmest U.S. winter on record. But, before summer gets here, there’s another question we ought to consider when it comes to soybeans: How quiet are they?
If you have read any of DTN’s Closing Market Comments over the past six months or caught any of the Closing Market Videos I do with DTN Senior Ag Meteorologist Bryce Anderson each day, you have probably grown tired of reading about soybeans’ sideways range or hearing me mention “another day of quiet trading.”
While it is common for grains to show quieter trading activity in the months after harvest, the winter of 2015-16 has not been typical. Not only was it the warmest winter on record for the contiguous U.S., it was also the quietest period of trading for soybeans in over 20 years. Before you say, “so what,” let me explain why that’s important.
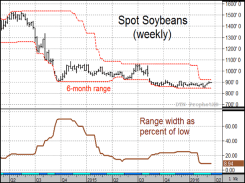
There are different ways of measuring trading activity in markets and, thanks to the magic of DTN’s ProphetX software, I created my own indicator which I call RangeWidth. Very simply, it measures the difference between soybeans’ high and low over the past six months and keeps a running tally of that difference below my price chart.
Since trading ranges are naturally greater when soybeans are at $15 a bushel than when they are at $9 a bushel, I tweaked the indicator to express the range as a percent of the six-month low. For example, the high of spot soybean futures over the past six months is $9.19 3/4 and the low is $8.44 1/4. My RangeWidth indicator currently reads 8.94, meaning that the high of the past six months is 8.94% above the low.
As we look back over the weekly history of spot soybean futures, a six-month range of 8.94% is the lowest that spot soybeans have shown since May 1995. You may remember the spring of 1995 as the start of one of the more bullish periods on record. Spot soybeans trading below $6 in May climbed higher the rest of that year and reached $8.56 by July 2006.
Stay up to date on all T-L news and get alerts on special pricing!


